Foreword
This website started as a means to present data on SIMD and so the front page is locked in to that concept because some kind authors have cited to this page and created links to it on their websites. The rest of the website informs over a wider range of subjects – there is more to this website than just SIMD. It has for each local authority a page describing the state of primary and secondary school education, recorded crime data for each ward as well as SIMD data. If you are interested in data for your local authority please see: local-authority-navigation-aid the sitemap or browse the right hand side navigation.
Scottish Index of Multiple Deprivation
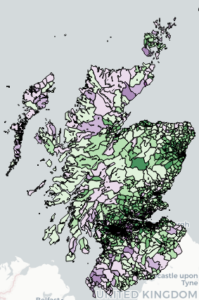
| SIMD map 2020: interactive maps of Scotland showing the impact of deprivation in each of the SIMD zones. SIMD analysis is the key measure of deprivation in Scotland and is published at approximately four yearly interval by the Scottish Government (ScotGov) following detailed analysis across the whole of the country. It measures deprivation in relation to more than income and health and so SIMD includes factors like access to opportunities in employment and in education, the impact of crime and of geographical isolation. Typically, deprivation is concentrated in the post-industrialisation areas – Glasgow City and the surrounding towns in the Central Belt and in the West of Scotland. These areas suffered high levels of unemployment as light and heavy industries and mining declined in the 1970s and 1980s. Also, rural areas such as the the Northern Highlands, Grampian Highlands, Harris and Lewis and the Southern Uplands also show high levels of deprivation.
Click on the seven links below to see full-sized maps covering the whole of Scotland Click on this link to go to list of SIMD for your Local Authority Similar data exists in the rest of the UK although slightly different approaches are used to measure deprivation |
Also on This Website
Health :: Health Navigation Aid Education :: Education Navigation Aid Crime :: Crime Navigation Aid Local Authority :: LA Navigation Aid SIMD :: SIMD Navigation Aid The Local Authority Navigation Aid page provides a list of all the Local Authority specific pages covering topics like education (primary and secondary school ranks), deprivation and crime. There is a section for pages and posts that are Scotland wide including Airbnb. See also Posts by Categories and Sitemap
|
| SIMD-2020-overall-deprivation |
|
Social Deprivation in Scotland
Every four years data the Scottish Government publishes data which provides a set of relative measures of Scotland’s deprivation. The data informs policy makers and action groups on the regional and local differences in deprivation. The process takes into account many factors contributing to deprivation: health, income, education, employment, housing, access for rural communities to services and isolation, and crime. Results for each of these deprivation measures is provided as part of the open data initiative. Scotland is split up into 6976 individual zones for analysis with each containing approximately 700 to 800 people. The most recent data, SIMD 2020, was published in Jan 2020.
Datamap-scotland publishes data covering the whole of Scotland over-laid on a map of the country which shows the geographical relationship between groups of deprived areas which are frequently grouped into localised clusters. In cities and towns the zones are small because of the high population density and you will need to expand the map to see the zones in detail.
The chart shows the numbers of citizens living in deprived zones in each of Scotland’s local councils.
It is important to note that not all households within a zone will have the same level of deprivation and deprived areas and relatively affluent areas can be located within the same street / location.
For details of the oversight and methodology of the data collection used by the Scottish Government please see:
https://www.gov.scot/collections/scottish-index-of-multiple-deprivation-2020/
Further posts will follow covering socio-economic issues related to deprivation.
Life Expectancy and Deprivation in Scotland
Life expectancy in Scotland is the lowest in the UK and amongst to lowest in Europe. Further posts will investigate Life Expectancy data for Females and Males in Scotland presenting the results on maps and graphs.
Health Profiles and Deprivation in Scotland
Poor health status is associated with deprivation. We will obtain open source data from ScotGov sources and publish maps and graphs to inform the public on the impact of deprivation on health outcomes.
Airbnb Growth
The growth in short term lets listed on airbnb’s website in the highlands and in Scotland’s major cities is a cause of concern for local people, either as a result of its impact on the availability of affordable housing or as a result of the impact of anti-social behaviour of some holidaymakers on local residents. A distribution map of airbnb short term lets in Scotland is made available for the first time.
Crime: Scottish Reported Crime Data
A series of posts / pages analysing Scotland’s Reported Crime data by Local Authority / Council Ward, by crime categories, by year:
- Scotland Reported Crime Data
- Glasgow City Wards Reported Crime Data
- Scottish Crime Map by Local Authority Wards
- See also Deprivation due to Crime as part of the SIMD series of pages
Education: Scottish School League Tables
This site is the best free source of current Scottish school performance data for both primary and secondary schools. Updated annually.
- Scottish Secondary School League Tables
- Scottish Secondary Schools Performance Review
- Scottish Primary Schools League Tables
- PISA Ranking decline
