
Primary Schools Ranks in Glasgow City
Discover the latest Glasgow City primary school ranks (league tables) based on official ACEL achievement data from the 2024/2025 academic year. Our analysis of 141 graded primary schools reveals 2 top-performing institutes in Band 1 (95-100% attainment), with 61 schools (43% of those graded) achieving above 75% combined proficiency in core subjects. Glasgow City schools are below to the Scottish average, maintaining an attainment rate of 76% compared to the national 81%. Explore interactive maps of catchment areas, detailed performance tables spanning five academic years, and downloadable achievement reports to make informed decisions about primary education in the region.
On this page:
- A location map showing schools’ catchment areas and rankings (or league tables) within the Local Authority
- A table showing primary school performance over a number of years
- A download of achievement data as published by ACEL for each primary school in the Local Authority
- Glasgow City Comparison with other Scottish Local Authorities
Assessment of Primary Schools’ Performance
A number of measures are provided in the ACEL for each of subjects: Numeracy, Reading, Writing, and Listening and Talking and are provided as Reading – % Meeting Level, Writing – % Meeting Level and Numeracy – % Meeting Level. These four percentages are provided for P1, P4, P7 and also for P1, P4, P7 combined. For the analysis on this website the P1, P4, P7 combined data was used since it covers entry level, mid and final year classes within each primary school.
Allocation of Schools into Bands
Schools were graded according to the ACEL data for P1, P4 & P7 combined achievement (the total of the percentage meeting the target level in the four measures: Listening & Talking, Numeracy, Reading and Writing. The best performing schools are allocated to Band 1 and the worst schools to band 10. Where the number of pupils in a class are small the authorities withhold data to maintain anonymity. In the map data these are shown as n/a in grey. For further details of the band boundaries see Methods and Notes below.
Glasgow City Primary School Performance
In Glasgow City there were 142 primary schools in the published ACEL assessment data for Glasgow City of which 141 had their assessments published.
Band 1: 95 – 100% of pupils meeting the required level
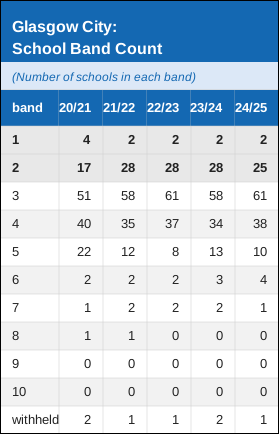
There were 2 schools in this category representing 1% of graded schools:
Hyndland Primary School::Garrowhill Primary School
Band 2: 85 – 94% of pupils meeting the required level
There were 25 schools in this category representing 18% of graded schools:
Oakwood Primary School::Battlefield Primary School::Broomhill Primary School::Garnetbank Primary School::Hillhead Primary School::Kelvindale Primary School::King’s Park Primary School::Wallacewell Primary School::Langside Primary School::Merrylee Primary School::Notre Dame Primary School::Sacred Heart Primary School::St Denis’ Primary School::St Fillan’s Primary School & Nursery Class::St Michael’s Primary School::St Teresa’s Primary School::St Thomas’ Primary School::Scotstoun Primary School::Glasgow Gaelic School::Darnley Primary School::St Blane’s Primary School::Carmunnock Primary School::St Joachim’s Primary School::Mount Vernon Primary School::Swinton Primary School
Band 3: 75 – 84% of pupils meeting the required level
There were a further 61 schools in this category representing 43% of graded schools:
Overall in Glasgow City a total of 88 schools were in bands 1-3 (i.e. with more than 75% of pupils reaching the required level) representing 88% of the graded schools.
Table 1: The number of primary schools in each band for years 2020/21 to 2024/25
View the above table as an accessible HTML (screen reader friendly) version
Links to All Local authorities
Please follow this link to find links to all the Local Authorities on this website or use the sitemap link (top of right hand panel).
Glasgow City Map
A map showing the location of primary schools within the Glasgow City area is shown (Figure 1). Catchment areas, where provided by the local authority are colour coded according to the achievement band of the primary school.
‘
‘
Glasgow City Primary School Ranks Table: All Schools

View the above table as an accessible HTML (screen reader friendly) version
Glasgow City Comparison with Scottish Local Authorities

View Scotland summary as accessible table
Glasgow City Files and Downloads
The 2024/2025 ACEL data for the primary schools is available by following links from this website (see underneath).
Glasgow City Scottish Education Dept ACEL Data File
Methods and Notes
Data
The most recent data was for school year 2024/2025 which is published during 2025.
All Analysis
A number of measures are provided in the ACEL data. Assessments in classes P1, P4, P7 and a combined P1/P4/P7 levels are provided for each of subjects: Numeracy, Reading, Writing, and Listening and Talking. For the purposes of comparing and ranking schools the P1/P4/P7 combined scores were used and the total % meeting the level for each of the four subjects was averaged (Reading – % Meeting Level, Writing – % Meeting Level and Numeracy – % Meeting Level). Allocation of schools into Bands for mapping purposes was as follows:
Band 1: total between 380 and 400 – average 95 – 100% meeting required level
Band 2: total between 340 and 379 – average 85 – 94.9% meeting required level
Band 3: total between 300 and 339 – average 75 – 84.9% meeting required level
Band 4: total between 260 and 299 – average 65 – 74.9% meeting required level
Band 5: total between 220 and 259 – average 55 – 64.9% meeting required level
Band 6: total between 180 and 219 – average 45 – 54.9% meeting required level
Band 7: total between 140 and 179 – average 35 – 44.9% meeting required level
Band 8: total between 100 and 139 – average 25 – 34.9% meeting required level
Band 9: total between 60 and 99 – average 15 – 24.9% meeting required level
Band 10: total between 0 and 59 – average 0 – 14.9% meeting required level
Notes on School Catchment Areas
Some local authorities do not make schools’ catchment areas available (i.e. areas on the map that are coloured pale blue) and the catchment areas for catholic schools in some local authorities are not available.
Disclaimer
The catchment areas have been smoothed out a little in order to reduce the size of the web page download and will have slight differences. Parents should not rely on the datamap-scotland website to confirm the catchment area for any specific school or house within a zone as these can sometimes be very specific and may vary from data published by https://www.spatialhub.scot. Many authorities publish accurate street by street data on school catchment areas on their websites.
School Locations
Individual schools are shown on the map black circles. If you click on the school marker a pop-up will appear with additional information: the school name, 2024/2025 rank, school roll, number of FTE teachers and the school website address.