Scotland Recorded Crime Data By Year and Category 2018 to 2024
Data on recorded crime was obtained from the police data download site and subjected to analysis. On this page Scotland-wide data is discussed. Data at Ward level for Local Authorities is available elsewhere on this website (see links below). While the recorded crime data is grouped into broad categories of similar crimes, some of the crimes of interest to the public (murder, attempted murder, sexual assault, serious assault and knife crime) have been filtered out for separate treatment.
Key Findings 2017 to 2024
- Murder
The number of murders in Scotland has remained relatively stable over the period, with a small downward trend. - Attempted Murder
Attempted murder cases have also shown a decline. - Sexual Assault Including Rape
Sexual assaults including rape have increased over the period. - Serious Assault
Serious assaults, namely, those resulting in severe injuries such as fractures or lacerations requiring hospitalization, have also seen a downward trend. - Possession of Knives or Blades
The number of crimes recorded involving possession of a knife or a blade has increased,
On This Page
Data on Total Recorded Crime Current Classification
Data Supporting Key Findings: Murder, Assaults and Knives
Summary of Classification
Links to Individual Local Authority Pages
As a result of the changes in categorising it is important to be circumspect when comparing crime rate trends over long time periods which span the changeover in recording methodology. Analysis of trends is further complicated by the impact of lockdown over the years spanning 2020 to 2021. Nevertheless, there appears to be a slight upward trend in non-motoring crimes starting 2022 Q1
Data from overlapping datasets representing the old and new data grouping methodologies have been analysed. The old methodology dataset covers the period 2017 Q2 to 2023 Q1 and the new dataset from 2019 Q2 to 2024 Q4. This provides an overlap period from 2019 Q2 to 2023 Q1. The data has been further split to separate non-motor crimes from motoring offences. The data is represented in Figure 1. For non-motor crime there is a difference at the start of the overlap with the new system resulting in higher total offences. However, at the end of the period the two systems are almost identical. For motoring offences the new system consistently results in higher counts, the reason for this is not explained by the sources of the data.
Figure 1: Scotland All Crimes 2017 to 2024
Monthly recorded crime counts using data from Scottish Police showing, separately, non-motor related crime and motor offences. Early data is recorded using the old (superseded) categories and newer data uses the new categories. There is a period of overlap where both old and new categories apply.
Table 1: Recorded crimes 2020 to 2024 under the new classification
Figure 2: Scotland Recorded Crimes by Category 2020-2024
Murder and Attempted Murder
Data for murder and attempted murder crimes are counted in extracted from the Police Scotland Non-Sexual Crimes of Violence category based on the Crime Classification Descriptions – murder and attempted murder.
Murder
Scotland’s recorded murder data shows a sustained downward trend over the period (Figure 3, Table 2 ). The data , which fluctuates from year to year ranges from 65 (2018) to a low of 39 (2024).
Although not reported with the data, Police Scotland’s has achieved a remarkable 100% solve rate for homicides committed since 2013 (data up to end of fiscal year 2023/24. The decline in murders mirrors similar patterns seen in attempted murder and serious assault cases, suggesting broader improvements in public safety and crime prevention strategies.
Attempted Murder
The data for attempted murder is highly variable, possibly due to the difficulties in classifying cases as either attempted murder or serious assault. Nevertheless, over the period it too shows a reduction in cases since 2018. The attempted murder rate ranges from 298 cases (2018) to a low of 241 (2024), see 2able 2 and Figure 3.
Table 2: Annual Recorded Rates for Murders and Attempted Murder
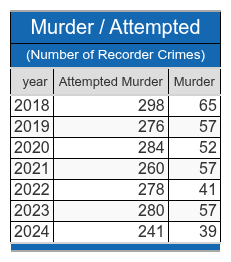
Figure 3: Monthly Rates of Murder and Attempted Murder in Scotland 2018 to 2024
Individual monthly recorded rates for Murder and Attempted Murder (red and blue markers) split out from the Non-Sexual Crimes of Violence category. The trend lines represent Ordinary Least Squares regression analysis of the data.
Sexual Assault Including Rape
The Police data publishes data under the category Sexual Assault including rape without breaking the data down further due to privacy constraints. Sexual crimes show large monthly fluctuations in recorded offences ranging from 1402 to 781 per month (Figure 4). Yearly counts have grown from 10,208 in 2019 to annual counts of over 14,500 from 2021 onwards which represents a significant and sustained increase in recorded sexual offences since 2021, maintaining higher levels than pre-pandemic periods (Table 3, Figure 4). Some reports attribute this increase to a greater willingness for victims to report crimes of this nature.
Table 3: Annual Sexual Offences from 2019 to 2024
Note data for 2018 not available
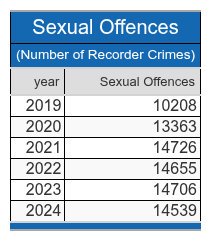
Figure 4: Annual Sexual Offences from 2019 to 2024
Individual monthly recorded rates for Sexual Crimes. The trend line represents Ordinary Least Squares regression analysis of the data.
Serious Assault
In Scottish police data, serious assaults, are those crimes those resulting in severe injuries such as fractures or lacerations requiring treatment of the victim at a hospital. Serious assault data is sourced from the Police Crime Group 1 (Non-sexual crimes of violence) filtered against the Crime Classification Description for the term “Serious Assault”.
The Police data shows a general downward trend in serious assaults from 2018-2024, despite monthly fluctuations (Table 4 and Figure 5). Monthly offences ranged from 168 to 402 incidents, with the highest numbers occurring in 2018-2019. The significant decline began during the pandemic in 2020 and continued through 2024.
In Scotland the serious assault rate has higher per-capita rate than England/Wales the serious assault rates than England/Wale. However, it is interesting to note the absolute rate in Scotland continues at approximately 20-25% below pre-pandemic levels, whereas the England/Wales data show assaults at or slightly above pre-pandemic levels (violent crime (including serious assaults) returning to pre-pandemic levels by 2023).
Table 4: Annual Serious Assault Offences 2018 to 2024
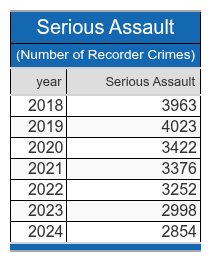
Figure 5: Monthly Rates of Serious Assault in Scotland 2018 to 2024
Individual monthly recorded rates for Serious Assault. The trend line represents Ordinary Least Squares regression analysis of the data.
Possession of Knives or Blades
This group comprises mainly crimes of possession of knives or blades in a public place where they have not been recorded against a more serious crime such as an assault.
In 2018 knife crimes were 2,476 per year jumping to an average 0f 4,700 per year thereafter and annual counts that are relatively stable. The data for 2018 was obtained using the older categorisation system and it is possible that the post 2018 data reflects the different methodology used to classify knife crimes. Also, there was a minimal pandemic effect, unlike other crimes which showed a dip in 2020. Per capita Scotland has a lower knife crime rate than England and Wales
Table 5: Annual Knife Crime Offences 2018 to 2024
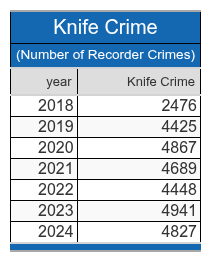
Figure 6: Annual Knife Crime Offences 2018 to 2024
Classification of Crimes in Scotland
The Scottish Police Force/ Scottish Government have since 2019 changed the categorisation of recorded crime information. Published data provides recorded crime data that is broken down into eight major crime categories. Each crime category is recorded against and two hundred sixty-five sub categories (see Scottish Crime Classification for details of how crime is recorded at this level). The data is provided for every by Local Authority Wards. This website analyses the data primarily at the major category level, the complete data including sub-categories can be downloaded from the cited government website. Crime data published up to mid 2019 was recoded as belonging to seven categories and only fifty-two sub categories.
Superseded classification up to 2019 seven categories, fifty-two subcategories
|
Current Classification 2019 onwards eight categories, two hundred sixty-five subcategories
|
Links To Individual Local Authority Pages
Detailed analysis for every Local authority is available on this website. Each page will feature:
- a map of the local authority showing the most recent crime data for each council ward in the local authority
- a table of crimes by classification within the local authority
- a table of crime rates in each council ward
- a chart showing crimes in each ward by year and classification
- a download file with summary data for each local authority
- a download file with all the raw data – by council ward, by year, by classification, by sub-classification
Aberdeen City Crime Map
Aberdeenshire Crime Map
Angus Crime Map
Argyll & Bute Crime Map
City of Edinburgh Crime Map
Clackmannanshire Crime Map
Dumfries and Galloway Crime Map
Dundee City Crime Map
East Ayrshire Crime Map
East Dunbartonshire Crime Map
East Lothian Crime Map
East Renfrewshire Crime Map
Falkirk Crime Map
Fife Crime Map
Glasgow City Crime Map
Highland Crime Map
Inverclyde Crime Map
Midlothian Crime Map
Moray Crime Map
Na H-Eileanan Siar Crime Map
North Ayrshire Crime Map
North Lanarkshire Crime Map
Orkney Islands Crime Map
Perth and Kinross Crime Map
Renfrewshire Crime Map
Scottish Borders Crime Map
Shetland Islands Crime Map
South Ayrshire Crime Map
South Lanarkshire Crime Map
Stirling Crime Map
West Dunbartonshire Crime Map
West Lothian Crime Map
Data Sources
Scottish Crime Data is available on the police website via https://www.scotland.police.uk/about-us/how-we-do-it/crime-data.
Shapefiles for UK Council Wards (district_borough_unitary_ward_region) is available from https://osdatahub.os.uk/downloads/open/BoundaryLine.
Ward population data was based on https://www.nrscotland.gov.uk/statistics-and-data/statistics/statistics-by-theme/population/population-estimates/2011-based-special-area-population-estimates/electoral-ward-population-estimates.
Methods in Brief
- Multiple annual crime data files (provided as fiscal years) were combined and calendar years were allocated to the data.
- Population data was added however, as no data was available after 2021, the 2021 data was used carried forward and rates per 1000 population calculated. Ranks for each Ward were calculated based on the Crime Rate per 1000.
- Some remapping of wards was carried out since the police data in a few cases did not map precisely to ward codes. E.g. the police data combined Arran and Ardrossan (wards in North Ayrshire LA. Some data is missing from the maps since it was not possible to properly map data for the Hebridean Isles as reported data appeared to be from overlapping wards.
- Maps were prepared using Python with Folium and Geopandas modules
- Figures, graphs and tables were prepared using Python and the Plotly module.